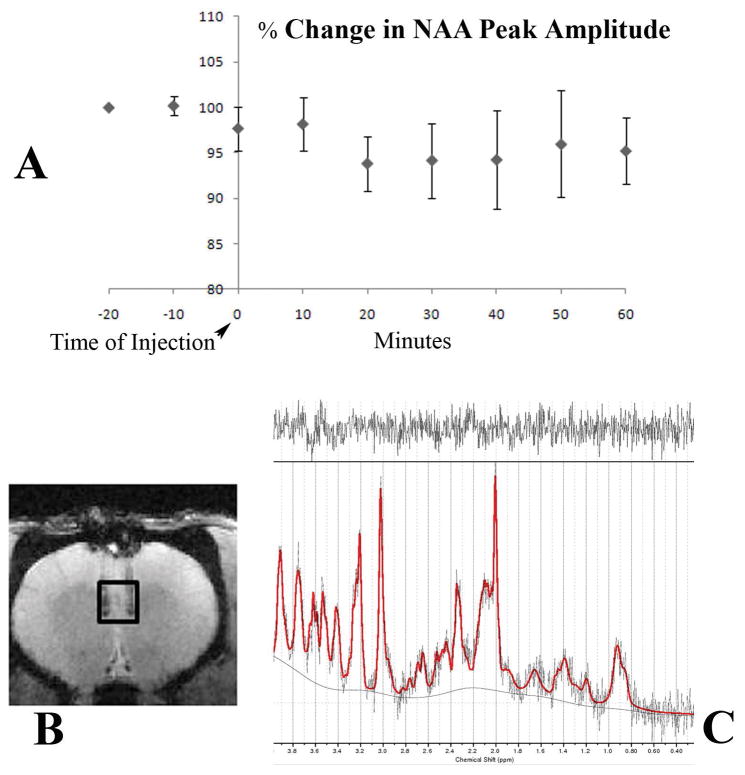
Figure 6. Changes NAA peak amplitude in mPFC with DREADDs activation.
(A) Mean percent change in NAA peak amplitude, corrected for the average BOLD response, is plotted in 10-minute bins. The error bars represent standard deviation. The image depicted in (B) shows the site of the injection and the VOI used. The spectrum shown in (C) shows a typical LCModel output.

