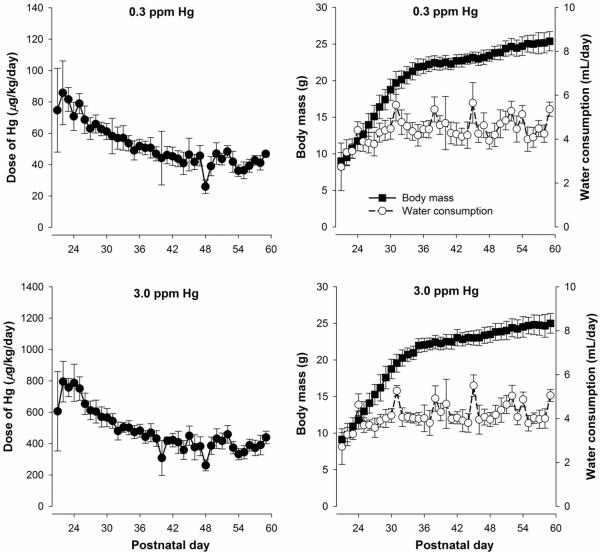
Figure 1.
Left panels: Mean (±SD) dose of MeHg as a function of postnatal day for mice exposed to 0.3 (top) and 3.0 ppm MeHg (bottom) during the adolescent period (postnatal day 21 through 59). Doses were estimated by by averaging the intake of two pair-housed mice. Right panels: Mean (±SD) body mass and water consumption throughout adolescence. Note the y-axes in the left panels differ by an order of magnitude and all error bars represent one SD rather than one SEM.

