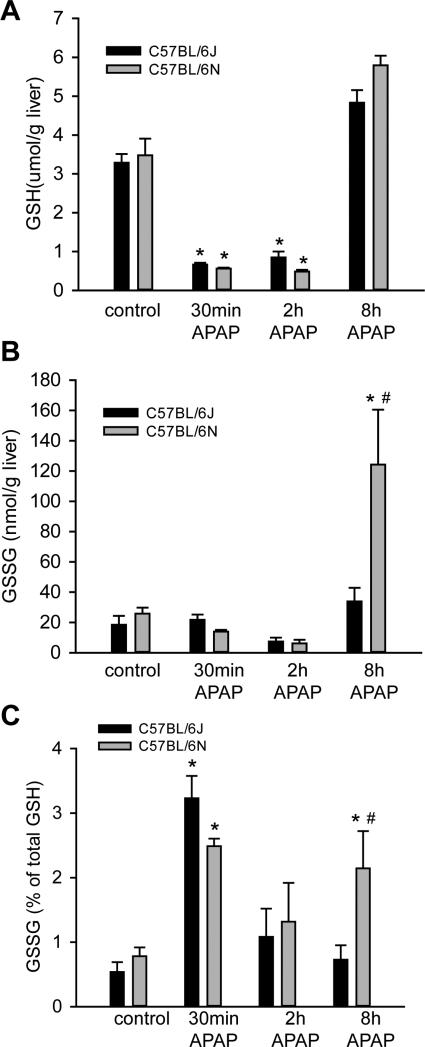
Figure 2.
Liver GSH and GSSG content after APAP treatment. C57BL/6J and C57BL/6N mice were treated with 200 mg/kg APAP or saline as control. Total GSH (A) was measured in liver tissue homogenate at 0.5, 2 and 8 h post-APAP and in control mice. GSSG was measured at the same times in C57BL/6J and C57BL/6N mice (B) and the percent of GSSG compared to total GSH was calculated (C). Data represent means ± SE of n=4 animals per group. *p< 0.05 (compared with controls, t=0). #p< 0.05 (compared with C57BL/6J mice treated with APAP).

