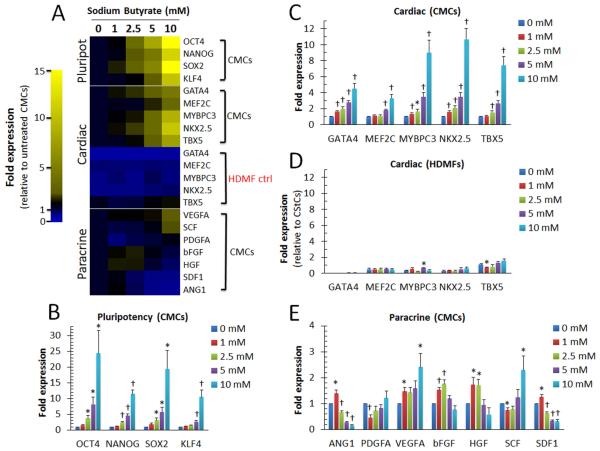
Figure 2.
Concentration-dependent effects of NaBu exposure on CMC gene transcription. (A): Representative heat map summarizing qPCR-based gene expression assays employing gene specific primers targeting (B): stemness- (CMCs, n=6), (C-D): cardiac- (CMCs, n=8; HDMFs, n=3), and (E): paracrine- (CMCs, n=8) associated transcripts in cells treated with increasing concentrations of NaBu for 72 h. Yellow indicates an increase in fold change (>1) and blue a decrease in fold change (<1). Values are mean ± SEM. * P <0.05 (Relative to 0 mM) and † P <0.005 (Relative to 0 mM).

