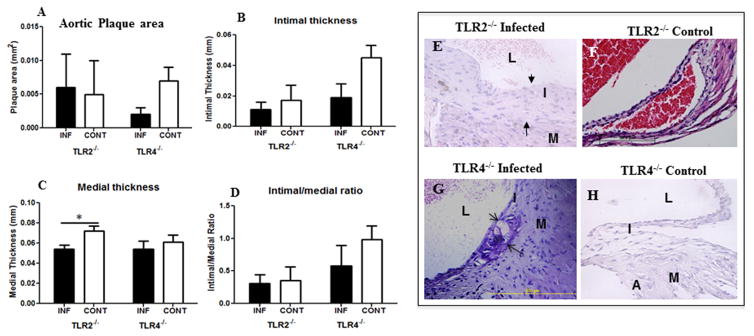
Figure 2. Polybacterial infection-induced changes in the aortic tissue after 24 weeks of chronic gingival infection.
(A) Bar graph of total aortic plaque area (mm2) in infected TLR2−/−, TLR4−/−, and uninfected TLR2−/−, TLR4−/−mice. (B) Bar graph showing intimal layer thickness area (mm) in infected TLR2−/− and TLR4−/− mice compared to uninfected control mice. (C) Bar graph showing medial layer thickness area (mm) in infected TLR2−/− and TLR4−/− mice compared to uninfected control mice. (D) Bar graph showing intimal/medial thickness ratio in infected TLR2−/− and TLR4−/− mice compared to uninfected control mice. (E) Representative cross section of 24 weeks polybacterial-infected TLR2−/− mouse aorta. (F) Representative cross section of 24 weeks uninfected control TLR2−/− mouse aorta. (G) Representative cross section of 24 weeks polybacterial-infected TLR4−/− mouse aorta. (H). Representative cross section of 24 weeks uninfected control TLR4−/− mouse aorta. L-lumen; I- intimal layer; M-medial layer; A- adventitial layer; and arrow indicate plaque. INF indicates infected (n = 6) and CONT indicates uninfected mice (n = 6).

