
Figure 4.
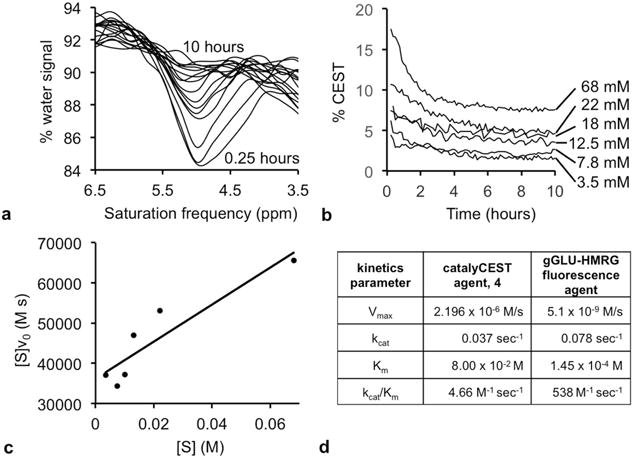
Michaelis-Menten enzyme kinetics. (a) The CEST spectrum showed a loss of the CEST at 4.8 ppm from 0.25 hours to 10 hours after adding enzyme to a 68 mM sample of the agent. (b) The % CEST at 4.8 ppm decreased when 0.4 units of GGT enzyme was added to each sample of the agent at different concentrations. The signal values were converted to concentrations (using the calibration shown in Sup. Fig. S4), and the initial reaction velocity, v0, was determined from the loss in concentration during the first 2.5 hours after adding GGT enzyme to each sample. (c) A Hanes-Woolf plot was used to determine Michaelis-Menten kinetics parameters. (d) The kcat rate of catalysis of the catalyCEST agent was comparable to the catalysis rate of a fluorescence agent. However, the KM dissociation constant was higher for the catalyCEST agent, leading to a lower kcat/KM catalytic efficiency for the catalyCEST agent.