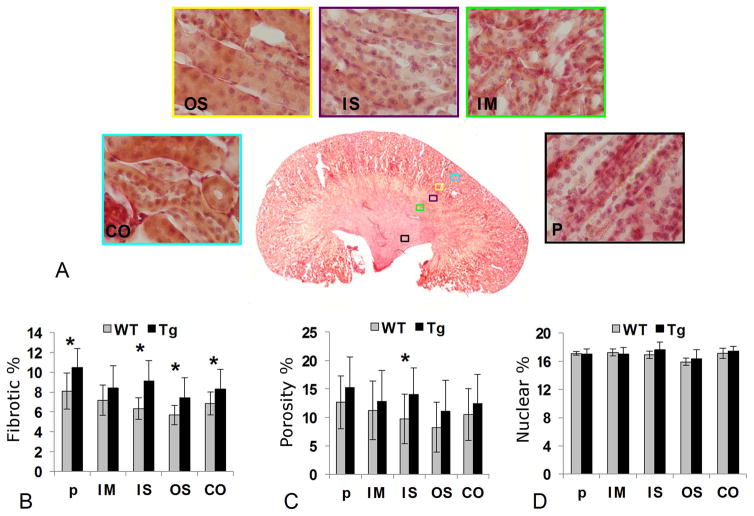
Fig. 4.
In A, five ROIs are shown in a histology section of a WT kidney: pelvis (P), inner medulla (IM), inner stripe of outer medulla (IS), outer stripe of outer medulla (OS) and cortex (CO). The bar plot in B shows a comparison of the fibrosis in % for WT and Tg. The bar plot in C shows an estimate of the porosity (the combined interstitial, vessel and lumen space) in WT and Tg and the final bar plot in D shows a count of the nuclei in the ROIs in WT and Tg which gives a estimate of the cell density.

