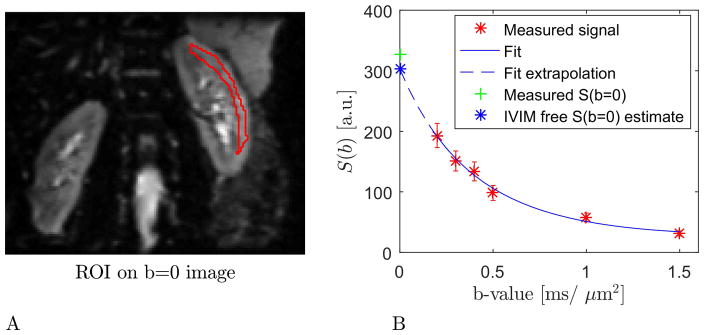
Fig 5.
The region of kidney cortex used for b-value optimization is shown in panel A where the region is outlined in red and overlaid on the b=0 image. Panel B shows the DKI fit to the average signal decay curve from the region in panel A. Errorbars are 1 standard deviation wide. The figure also indicates how the fit allows extrapolation to a b=0 signal intensity free of IVIM contributions (blue marker).

