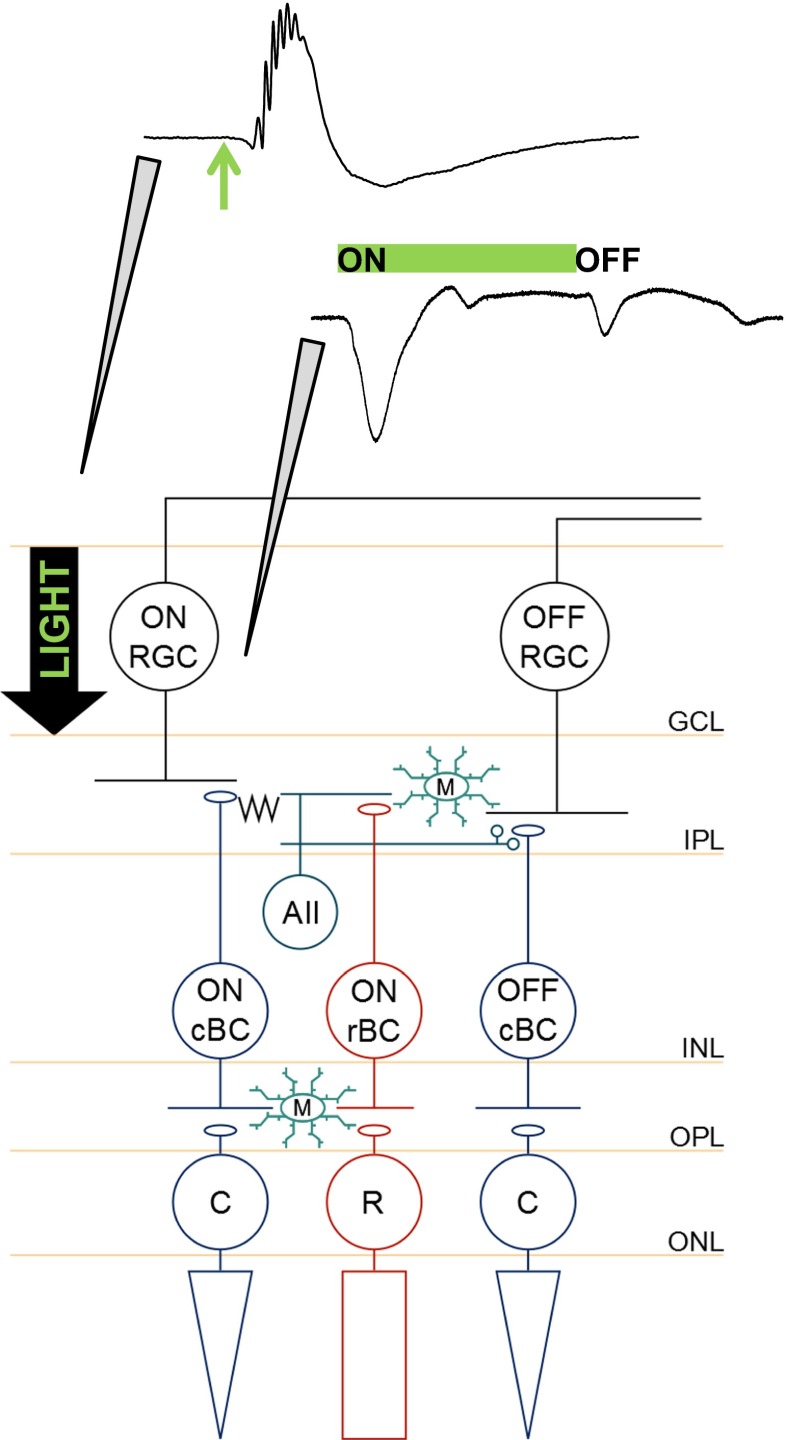
Fig. 1.
Placement of recording electrodes for acquisition of transretinal electroretinogram and retinal ganglion cell fEPSP responses. Schematic illustrates retinal circuitry and the respective positions of the recording electrode for the electrophysiological experiments. The retinal whole mount was placed in the bath, ganglion cell layer side up. The full-field light flash stimulus was placed above the slice, and the arrow shows the direction in which the light travelled. Top trace, Typical transretinal electroretinogram response recorded by lowering the electrode onto the surface of the retinal whole mount, without breaking into the layers. The response was repeatedly elicited by a single 10-ms duration flash (green arrow), with a 3-s interval. Bottom trace, Retinal ganglion cell fEPSPs were recorded by placing the electrode in the ganglion cell layer. The green bar represents the duration of the stimulus (1 s), which was repeated at 3-s intervals. Upon stimulus onset, an ON retinal ganglion cell fEPSP was generated. Stimulus offset produced an OFF retinal ganglion cell fEPSP. ONL outer nuclear layer, OPL outer plexiform layer, INL inner nuclear layer, IPL inner plexiform layer, GCL ganglion cell layer, M microglia, cBC cone bipolar cell, rBC rod bipolar cell, AII AII amacrine cell

