Fig. 3.
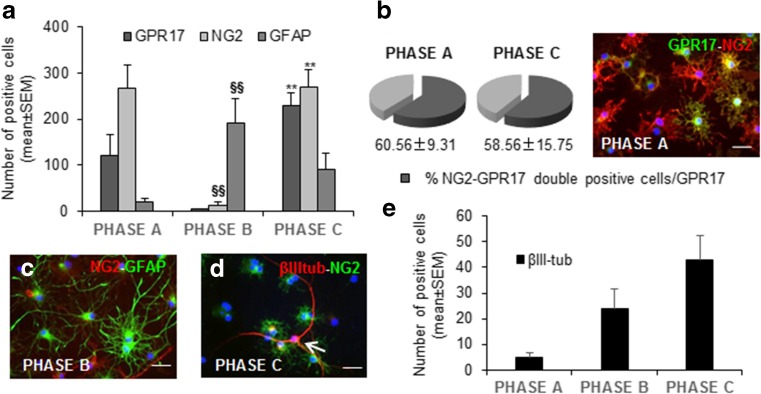
Generation of βIII-tubulin+ cells by exposing NG2+ OPCs to neurogenic protocol #1. a Histograms showing the number of cells expressing the cell markers NG2, GFAP, and GPR17 at the end of the three phases of neurogenic protocol #1 (data are the mean of 3–10 coverslips from 2–5 independent experiments; §§p < 0.01 compared to phase A; **p < 0.01 compared to phase B; one-way ANOVA Bonferroni post hoc test). b Pie charts showing the percentage of NG2-GPR17 double-positive cells over the total number of GPR17+ cells at the end of phases A and C. Data are the mean of 4–7 coverslips from 2–3 independent experiments. A representative image showing the co-localization of GPR17 (green) and NG2 (red) at the end of phase A is shown on the right. Scale bar, 100 μm. c, d Representative images of the progeny of NG2+ cells at the end of phases B and C. Arrow in d indicates a typical βIII-tubulin+ (βIII-tub) neuroblast, which does not co-express NG2 (see split fluorescence channels in Supplementary Fig. 1). Scale bars, 100 μm. e The graph shows the number of βIII-tub+ cells at the end of each phase of neurogenic protocol #1

