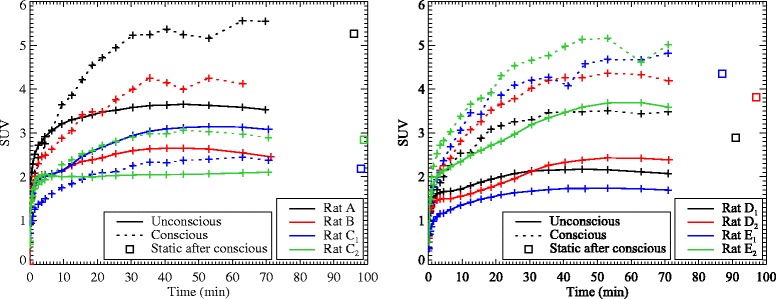
Fig. 5.

TACs for all eight data sets for the whole brain ROI, for the conscious (dotted lines) and unconscious (solid lines) scans, as well as the static scan with anaesthesia following the conscious scan (square points). The data sets are divided over two plots for clarity. For rats B and D2, the static scan data was not available. No error bars are plotted since the ROI is non-uniform
