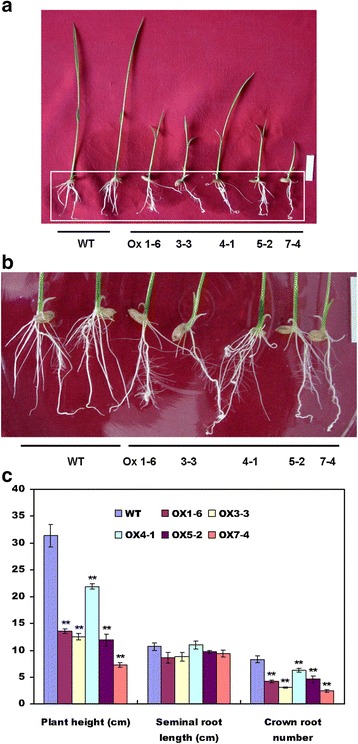
Fig. 5.

The phenotype of transgenic rice plants overexpressing OsWRKY80. a Plants (T2 generation) grew on ½ MS (containing 0.5% agar) for 14 d. Root architechure of each line in a box with white line is shown in (b). c Histogram showing plant height, seminal root length, crown root number of plants. At least 20 plants of each line were analyzed. Data are represented as mean values ± SE for three replicates. *, ** indicate a significant difference at P < 0.05, 0.01, respectively, between the transgenic and wild-type plants according to Duncan’s multiple range test. OX, overexpression lines; WT, wild-type plants
