Figure 4.
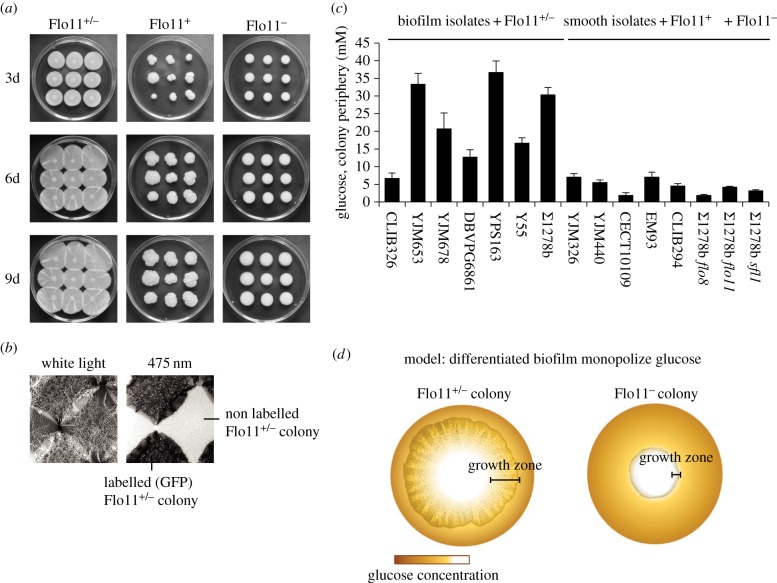
Differentiated biofilm colonies monopolize local resources before exhausting them. (a) Growth of wild-type Σ1278b, sfl1 and flo8 colonies after 3, 6 and 9 days. (b) Contact zones between four Flo11+/− colonies of which two expressed green fluorescent proteins (GFP) (white light, left; 475 nm light, right). (c) Glucose concentrations (means ± s.d.) below the rim of natural biofilm-forming isolates (CLIB326, YJM653, YJM678, DBVPG6861, YPS163, Y55) and Σ1278b compared with smooth (Flo11−) colonies (YJM326, YJM440, CECT10109, EM93, CLIB294, flo8, flo11) and the sfl1 (Flo11+) mutant. (d) Schematic diagram reconstructing how differentiated biofilm colonies monopolize glucose resources. High glucose concentration is shown in dark brown and low glucose concentration in white. Scale bars indicated the growing edge of a differentiated biofilm colony (left) and an undifferentiated smooth colony (right).

