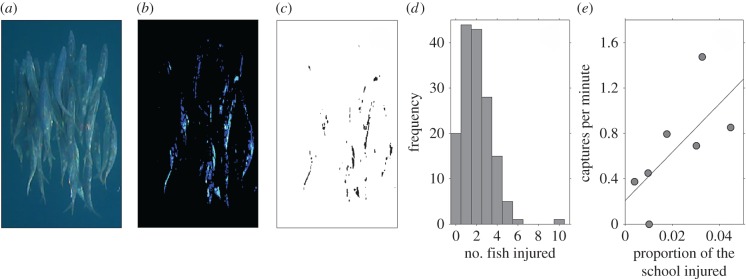
Figure 1.
(a) Original frame taken from one of the videos showing the white injury marks on the sardines caused by damage from sailfish bills. (b) The original image has its contrast and brightness adjusted before binary thresholding (c), which reveals the injuries on the sardines. (d) The minimum number of sardines that were hit with the bill during a sailfish's attack (determined for 158 attacks). (e) Relationship between the proportion of the school that was injured and the sailfish capture success rate on the prey schools. Solid line represents the least-squares regression; y = 21.4x + 0.21.

