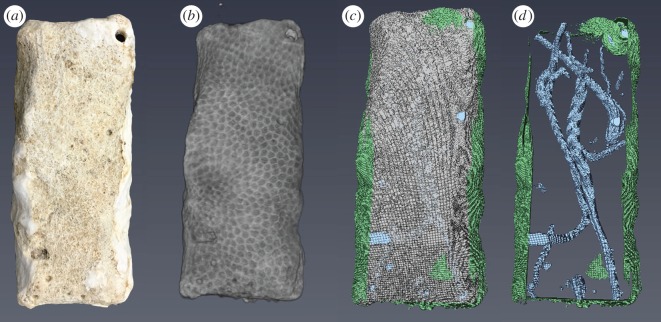
Figure 2.
Analysis of bioerosion accretion replicates (BARs). (a) Photograph of a dry BAR; (b) three-dimensional reconstruction of micro-CT scan of the same BAR; (c) volumetric analysis showing original carbonate (grey), macroboring (blue), and crustose coralline algae (green); (d) view showing only macro-bioerosion and crustose coralline algae. BARs are roughly 5 × 2 × 1 cm.

