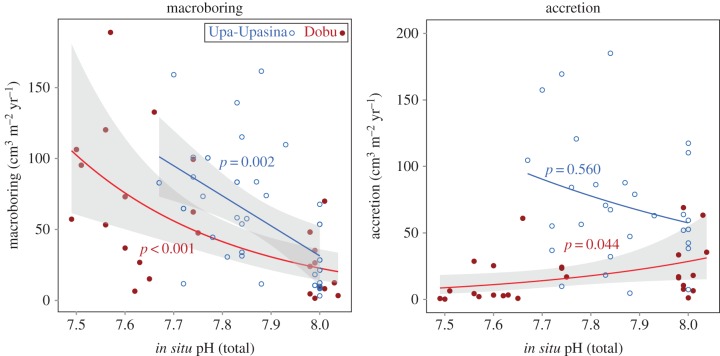
Figure 3.
Relationship between pH and accretion, as well as pH and macroboring at two volcanically acidified coral reefs, Upa-Upasina (blue) and Dobu (red). P-values are associated with each GLM. Grey regions surrounding significant relationships are 95% CI. Five values from Upa-Upasina not shown in accretion panel in order to better visualize Dobu trend.

