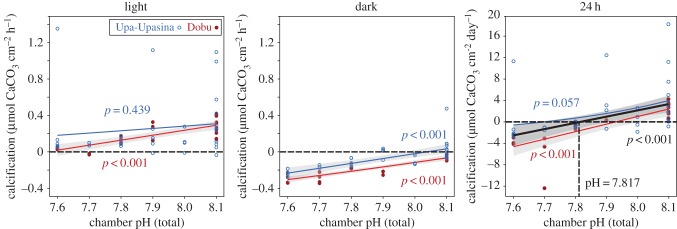
Figure 4.
Relationship between chamber pH and net community calcification (light, dark, and 24 h) as determined by alkalinity anomaly incubations of bioerosion accretion replicates (BARs) deployed at two volcanically acidified coral reefs, Upa-Upasina (blue) and Dobu (red). P-values are associated with each GLM. Grey regions surrounding significant relationships are 95% CI. Horizontal dashed line shows no net accretion or dissolution. Vertical dashed line in 24 h panel highlights the pH at which BAR replicates switch from net accretion to net erosion, averaged over both sites.

