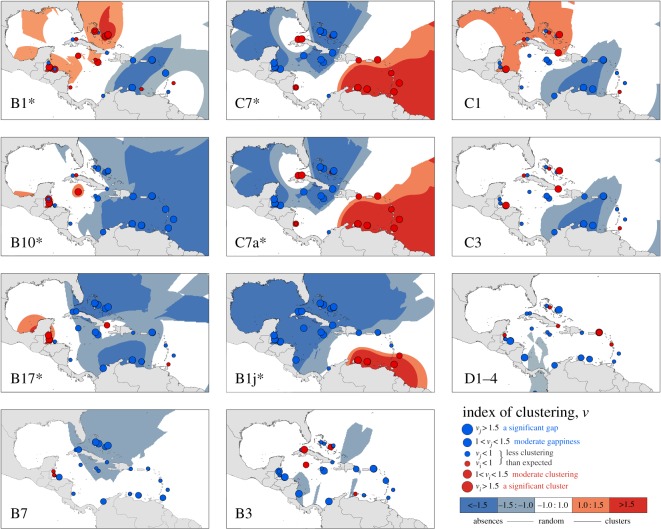
Figure 3.
SADIE index of aggregation plots highlighting areas and sites that showed significant positive (large red circles) and negative (large blue circles) clustering in terms of the presence/absence of Symbiodinium-ITS2 variants. Coloured areas highlight neighbouring groups of sites that share high (or low) degrees of clustering. Six ITS2 variants (B1, B17, B10, B1j, C7 and C7a) showed significant spatial patterns; *p < 0.05.

