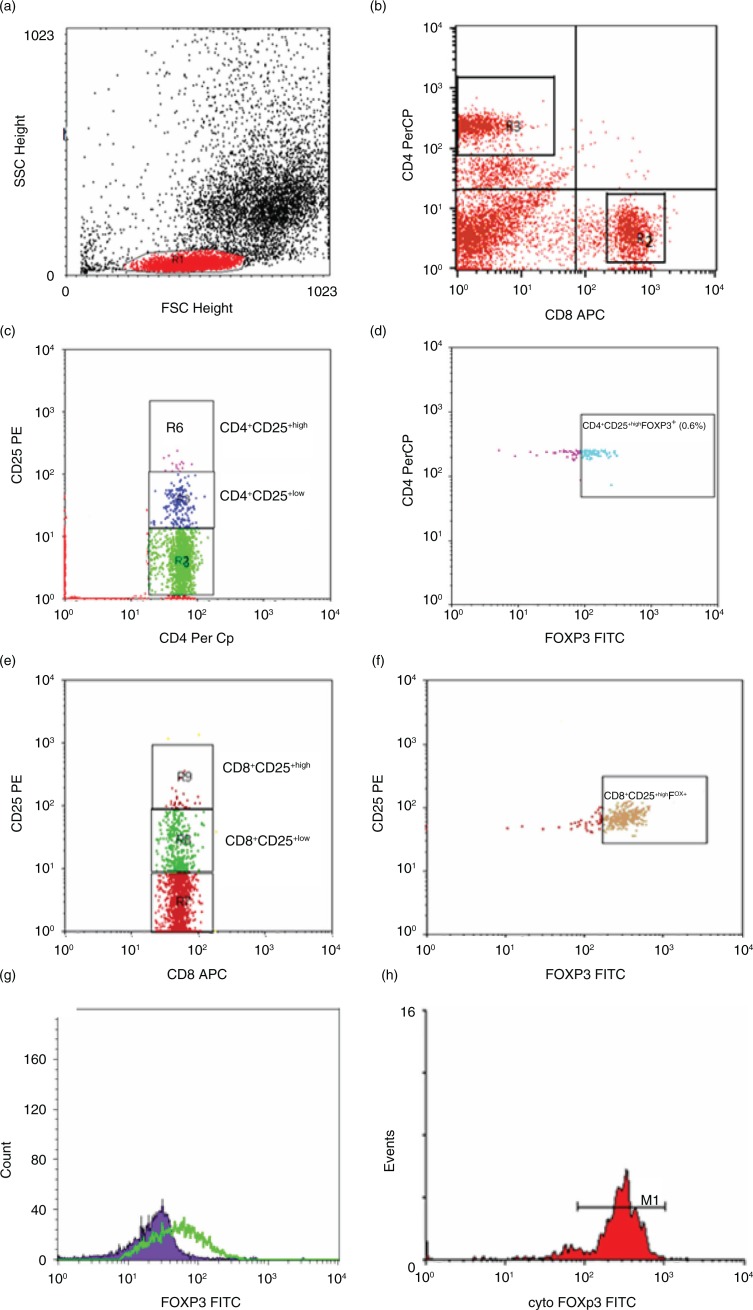
Fig. 2.
Flow cytometric detection of regulatory T cells. (a) Forward and side scatter histogram was used to define the lymphocytes population (R1). (b) The expression of CD8+ (R2) and CD4+ (R3) was assessed in lymphocytes population. (c) The expression of CD25 in CD4+ was detected and compared with the negative isotype control (not shown), and different gates were drowned to define CD4+CD25+low cells (R5) and CD4+CD25+High cells (R6). (d) The percentage of CD4+CD25+high FOXP3+cells (CD4+ regulatory T cells) was determined. (e, f) The detection of CD8+ regulatory T cells in CD8+ cells. The expression of CD25 in CD8+ was detected. Then, CD8+CD25+low cells (R8), and CD8+CD25+High (R9) cells and CD8+CD25+high FOXP3+cells (CD8+ regulatory T cells) were determined. (g, h) The expression of FOXP3+ in CD4+CD25+High cells CD8+CD25+high cells.

