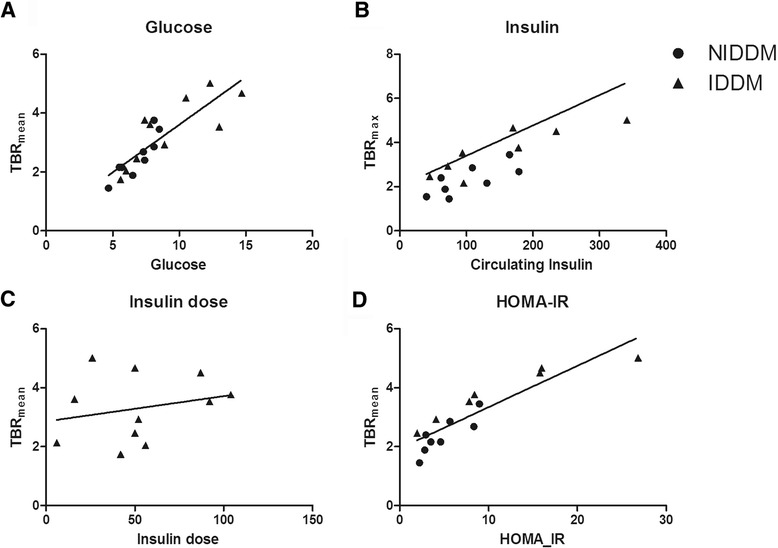
Fig. 2.

Target to Background ratio (TBRmean) significantly correlated to fasting glucose levels (Correlation coefficient: 0.845, p < 0.001) (a). Fasting insulin correlated significantly to TBRmean (b) but dose of exogenous insulin did not (Insulin: Correlation coefficient: 0.814, p < 0.001; Exogenous insulin dose: Correlation coefficient: 0.235, p = 0.486). Insulin resistance, measured by HOMA-IR, stongly associated with TBRmean (Correlation coefficient:, 0.876, p < 0.001)
