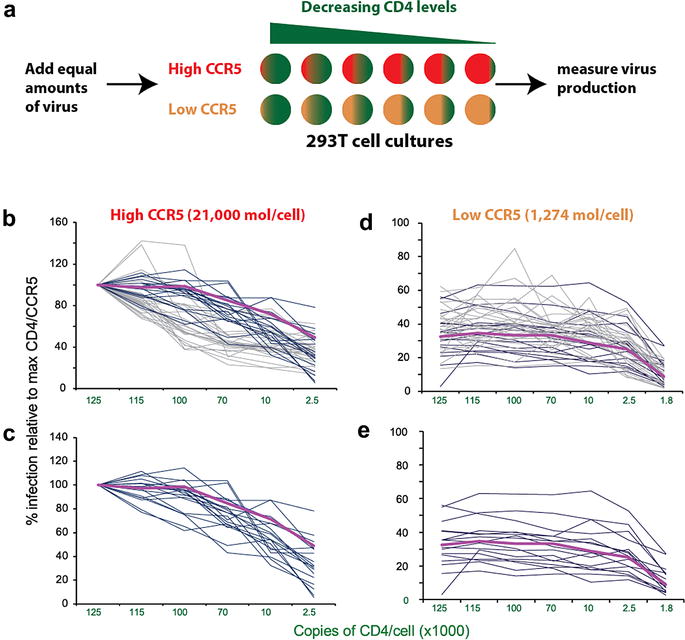
Fig. 7.

Using the Affinofile system to measure entry efficiency of the HIVenv_B chimeric viruses. a The 293-Affinofile cells were treated with ponasterone A (4 and 0.125 ng/ml) to obtain high (~15,830 copies/cell) and low CCR5 surface expression (~1365 copies/cell) and with increasing concentrations of minocycline to obtain range of CD4 surface expression (1800–125,000 copies/cell). 293T cells with different CD4/CCR5 levels were exposed to each of the Env pseudotyped viruses [25] using the Env expression plasmids derived the CHAVI AHI [7] (b, c) and the NYU/Aaron Diamond AHI cohort [25] (d, e). Virus production was monitored by luciferase expression from the LucAM transgene [25]. An average maximal infection was calculated from the relative light units (RLUs) produced from infection of 293T with the highest CD4 and CCR5 surface expression. All other levels of infectivity are plotted as a percentage of the RLU obtained relative to RLU with maximal CD4 and CCR5 expression. b, c Indicate levels of infectivity at high CCR5 over a range of CD4 and d, e, low CCR5 over a range of CD4. The level of infectivity was measured and presented for all HIV-1env clones derived from AHI (b), only those HIV-1env clones from CHAVI AHI patients which were also used to construct the SHIVenv pool (c). In all four graphs, the level of infectivity with the HIV-1env B3 clone (i.e. the SHIVenv_B clone establishing infection in the macaque) is indicated with purple line. The dark blue and light blue lines are the levels of infectivity using the AHI HIV-1env clones from CHAVI and the NYU/Aaron Diamond cohort, respectively
