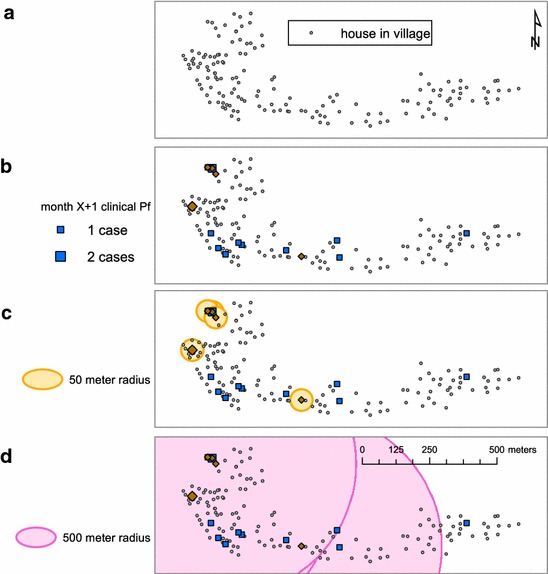
Fig. 2.

Maps indicating simulation steps. Index houses are selected in step a. During the next time step (b) secondary houses that overlap index houses are selected and the number of clinical cases in secondary houses is totalled. The process is then repeated by looking at secondary houses within buffers around the index houses beginning with a 50-m radius (c) and moving up to 500-m radius (d) around index houses
