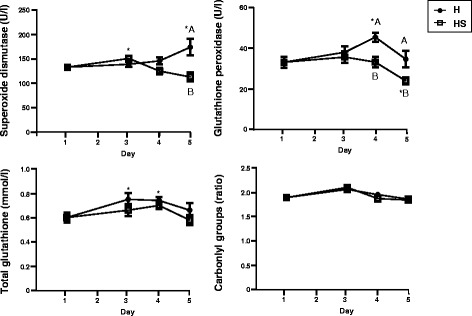
Fig. 2.

Average serum concentrations of oxidative stress markers in H and HS groups throughout the trial. Asterisks represent statistically significant differences between D3, D4 or D5 and basal levels (D1): *P < 0.05, **P < 0.01, ***P < 0.001. Different letter means significant differences between H and HS groups (P < 0.05)
