Fig. 3.

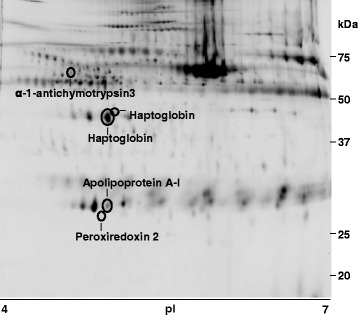
Serum proteome analysis by DIGE. Representative image of one of the four 2D gels containing 150 μg protein (50 μg prot/condition) and stained with Flamingo® (Bio-Rad). Differentially expressed spots identified by MS are marked

Serum proteome analysis by DIGE. Representative image of one of the four 2D gels containing 150 μg protein (50 μg prot/condition) and stained with Flamingo® (Bio-Rad). Differentially expressed spots identified by MS are marked