
Fig. 3.
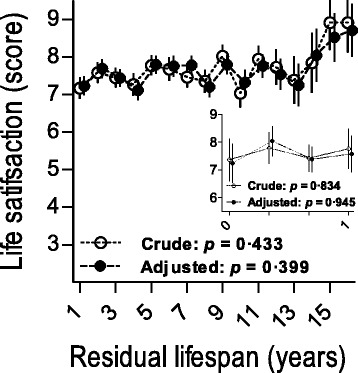
Life satisfaction estimated by residual lifespan, for all and for residual lifespan < 1 (n = 38). Estimates represent marginal estimated mean scores; error bars represent standard errors of mean. Crude estimates were adjusted for demographic variables only and adjusted estimates for demographic and mental health characteristics