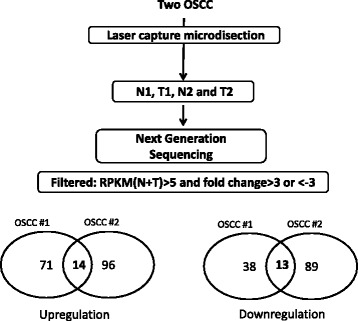
Fig. 1.

Flowchart for identifying abnormal lncRNA candidates through NGS. The OSCC specimens from two patients were stained using H&E staining. Normal and OSCC tissues were carefully separated and collected through microdissection. Total RNAs were extracted, and the transcriptome profiles were analyzed using NGS. Comparison of the lncRNA expression profiles between the tumor and normal samples in the filtering steps are as follows: (1) fold change ≥3 or <−3 and (2) sums of RPKM in normal and tumor tissues ≥5. Venn diagrams depicting the number of upregulated and downregulated lncRNA candidates in two paired samples of OSCC
