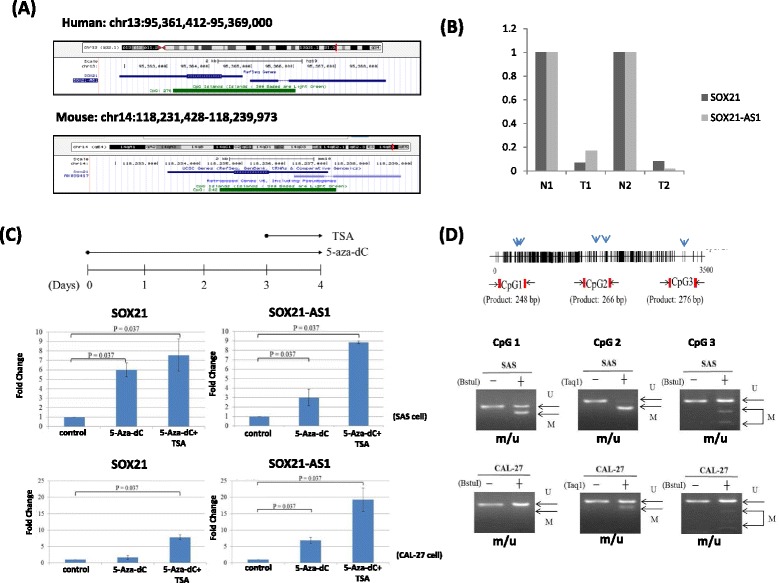
Fig. 2.

DNA methylation regulated expression of SOX21 and SOX21-AS1 in oral cancer cells. a Schema of the locations of the SOX21 and SOX21-AS1 genes from using the UCSC Genome Browser of the human genome GRCh37/hg19 (upper panel) and mouse genome GRCm38/mm10 (lower panel). Green blocks indicate the upstream CpG islands. b SOX21 and SOX21-AS1 expression was obtained from the NGS data. c SAS and CAL27 cells were treated with 10 μM 5-Aza-dC for 4 days, and 0.25 μM TSA was added on the third day (upper panel). After the cells were treated with 5-Aza-dC and TSA, SOX21 and SOX21-AS1 expression was examined using real-time PCR (lower panel). d Schema of the map of the CpG-rich region of SOX21-AS1. CpG sites are indicated with vertical ticks, and BstU1 or TaqI restriction sites are indicated with vertical arrows, in which the arrowheads indicate the primers used for analyzing the methylation status of CpG islands (CpG1 248 bp, CpG2 266 bp, and CpG3 276 bp), obtained through COBRA in this study (upper panel). DNA methylation status of CpG islands in SAS and CAL27 cells were examined using the COBRA assay. Arrows indicate the unmethylated (u)/methylated (m) alleles (lower panel)
