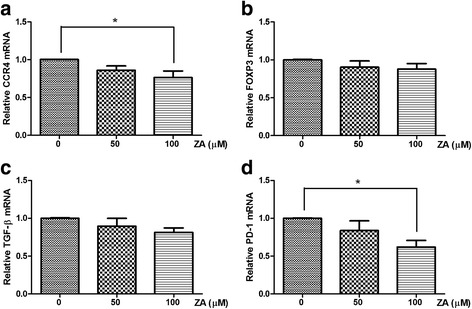
Fig. 4.

Influence of ZA on mRNA expression by Treg cells. mRNA levels were evaluated by qRT-PCR in Treg cells treated with 0, 50, 100 μM ZA for 6 h. The gene expression values were normalized to GAPDH expression. The relative mRNA expression of (a) CCR4, (b) Foxp3, (c) TGFβ and (d) PD-1 was calculated from Treg cells treated with ZA compared with untreated Treg cells. Values shown are means ± SEM of results from four independent experiments performed in duplicate. *p < 0.05
