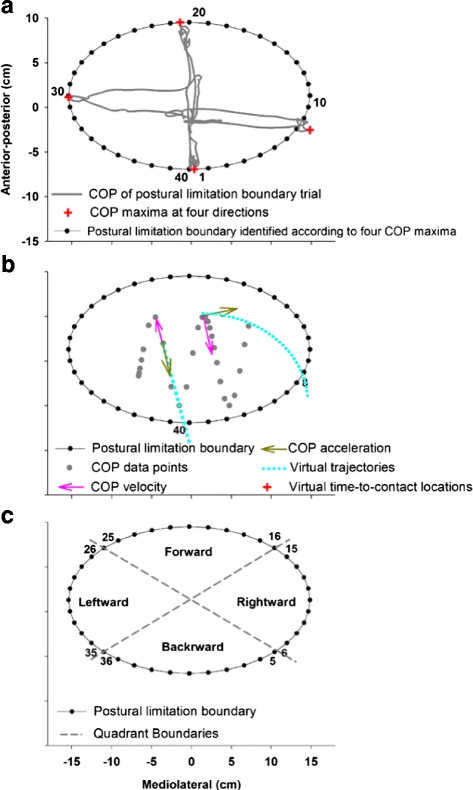
Fig. 2.

a The same 12-year-old TD participant’s COP time series recorded from the postural limitation boundary trial during which the participant slowly leaned forward, backward, and to each side. The maximum postural sway (red crosses) in each direction was used to model the postural limitation boundary (solid black line), which was then divided into 40 equal-sized segments (black dots, each with 9° expansion) identified in a counter-clockwise manner to quantify the spatial orientation of his VTC (ω)Spatial and VTC (τ)Temporal minima measurements. b Schematic representation of linear and nonlinear COP virtual trajectories (light blue dotted lines). The COP time series (gray dotted line) was amplified for demonstration purpose. The virtual trajectories were determined based on the velocity and acceleration of each COP data point (gray dot). The virtual trajectory has a parabolic shape if the COP data point’s initial velocity and acceleration are not co-linear (e.g., shown here intersecting with the postural limitation boundary at segment 8). The virtual trajectory is linear if the COP data point’s initial velocity and acceleration are in the same direction and either the velocity or acceleration vector is zero (e.g., shown here intersecting with the postural limitation boundary at segment 40). c Schematic of four quadrants defined for statistical analyses of VTC (ω)Spatial and VTC (τ)Temporal minima. Numerical labels represent the postural limitation boundary segments that were used to define quadrant in each direction. Each quadrant includes 10 postural limitation boundary segments with 90° expansions forward, backward, leftward, and rightward
