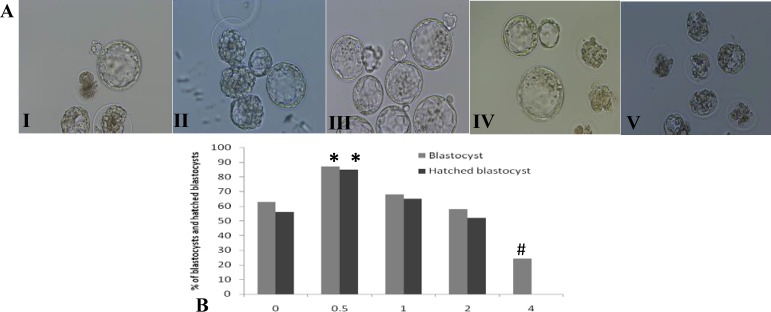
Figure 2.
A. Blastocysts and hatched blastocysts in different concentrations of L-carnitine (×200). (I) Control group, some of the blastocysts have grown and some are dead, (II) 0.5 mg/ml, the blastocysts are hatching, (III) 1 mg/ml, the blastocysts have grown and have started to hatch, (IV) 2 mg/ml, some of the blastocysts have grown and some of them have developmental delay or dead, (V) 4 mg/ml, all embryos are dead. B. The results of the percentage of blastocysts and hatched blastocysts in different concentrations of L-carnitine
* Favorable effect of L-carnitine vs. control group (p<0.05).
# Adverse effect of L-carnitine vs. control group (p<0.05).

