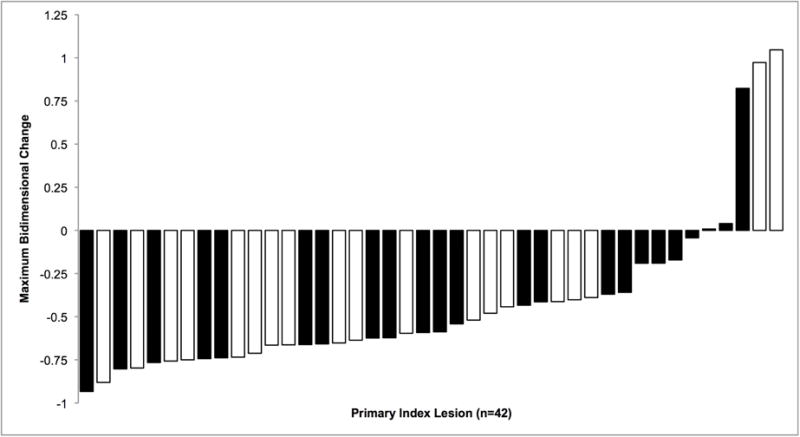
Figure 3.

Waterfall plot of maximum size change for WHO measurements in (n=42) primary index lesions after Y90 (black bars) versus cTACE (white bars). Negative values represent reductions in tumor size with ≥50% reduction (−) defined as partial response and >25% increase (+) in size progressive disease.
