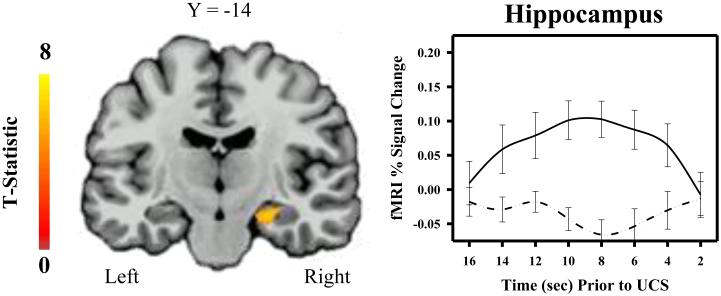
Figure 3.
Hippocampal activity and temporal conditioning. Hippocampal activity increased during the inter-trial interval of the temporal conditioning (i.e., fixed interval UCS; solid line), but not control (i.e., random interval UCS; dotted line) procedure. Graphs depict mean fMRI signal (% change) prior to UCS presentation.

