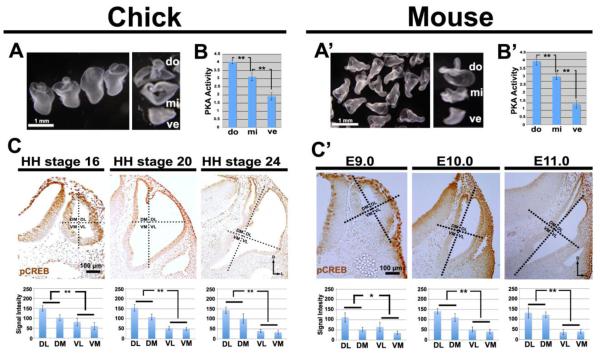
Figure 1. PKA activity and pCREB labeling form dorsal-high to ventral-low gradients in chick and mouse otocysts.
(A, A’) Collection of chick (HH stage 24) and mouse (E10.5-E11.0) otocyst dorsal (do), middle (mi), and ventral (ve) fragments to assess PKA activity. (B, B’) Graphs showing the mean levels of PKA activity assayed in the three groups of pooled fragments in each organism (unit: pmol ATP/min/µg protein). n=9 chick PKA assays; n=4 mouse PKA assays. (C, C’) pCREB labeling in sections of chick (HH stages 16, 20, and 24) and mouse (E9.0, E10.0, and E11.0) otocysts, and graphs showing mean levels of pCREB signal intensity (unit: 8-bit gray scale value; minimum: 0, maximum: 255). Chick: n=5 embryos at HH stage 16, n=9 embryos at HH stage 20, n=12 embryos at HH stage 24; mouse: n=5 embryos for each of the three stages. Dotted lines indicate the subdivision of the otocyst into quadrants (DM, dorsomedial; DL, dorsolateral; VM, ventromedial; VL, ventrolateral) used for quantification. Abbreviations here and in subsequent figures: *, P<0.05; **, P<0.01; D, dorsal; L, lateral.

