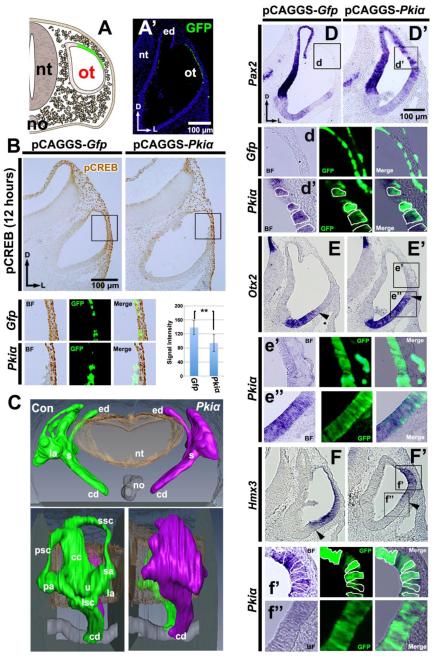
Figure 3. Pkiα overexpression in the dorsolateral otocyst also ventralizes the otocyst.
(A) Scheme showing targeting of the dorsolateral wall of the otocyst by electroporation of Pkiα and Gfp and (A’) a transverse section 12 hours after transfection with Gfp. (B) Detection of pCREB in sections of chick otocysts collected 12 hours after overexpression of Gfp alone, or of Pkiα and Gfp. n=11 embryos analyzed for both controls and experimentals. Boxes show regions enlarged below. Graph shows the mean value of pCREB signal intensity (unit: 8-bit gray scale value; minimum: 0, maximum: 255) that was assessed specifically in transfected (GFP positive) cells. (C) Reconstruction of serial sections of chick inner ears collected 5-6 days after Pkiα overexpression. Frontal (top single panel) and lateral (bottom paired panels) are shown. n=6 embryos sectioned; n=1 embryo reconstructed. (D-F) ISH of sections of chick otocysts collected 12-16 hours after Pkiα overexpression showing Pax2, Otx2, and Hmx3 expression. n=6 for both control and experimental embryos for each gene. Boxes show regions enlarged below, with borders of selected cells outlined. Arrowheads indicate the boundary of the dorsal Otx2- and ventral Hmx3-expression domains.

