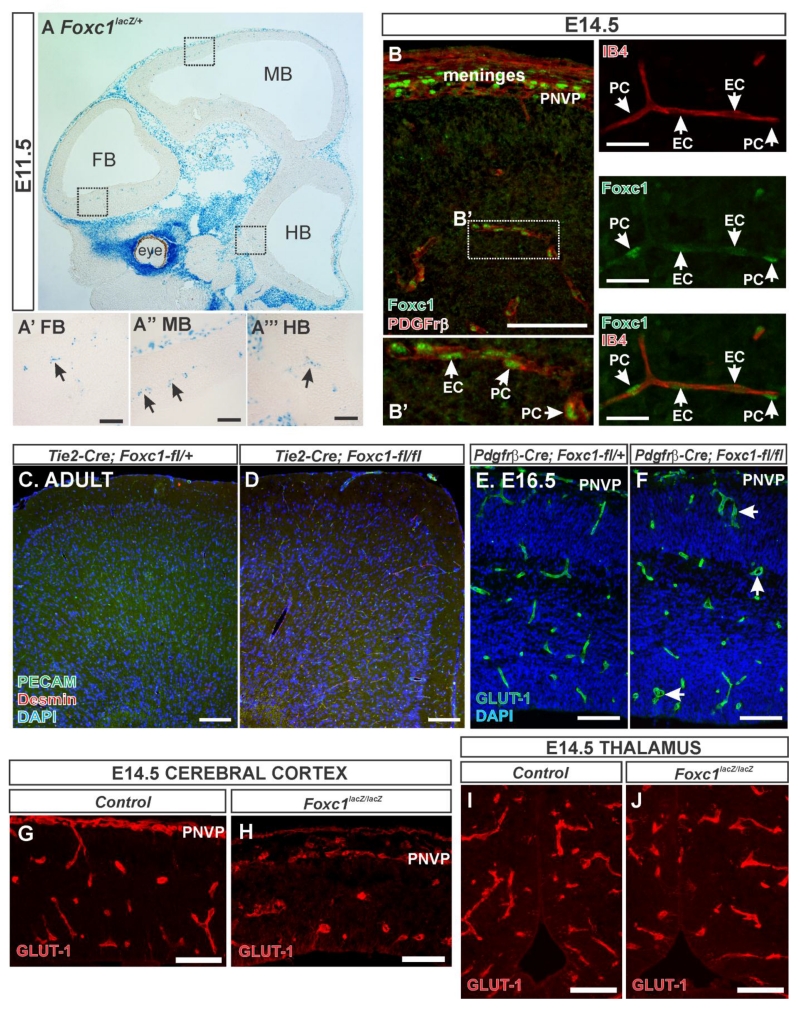
Figure 2.
(A) β-galactosidase (β-gal) activity reflecting Foxc1 expression in a sagittal section of an E11.5 whole head of a Foxc1lacZ/+ embryo. Boxed areas in (A) are provided as high magnification images of β-gal+ cells in the (A’) forebrain, (A”) midbrain and (A”’) hindbrain. (B) Foxc1 (green) and PDGFrβ (red) immunostaining of E14.5 cerebral cortices and overlying PNVP and meninges. Boxed area in (B) is shown at higher magnification in (B’) depicting Foxc1 protein expression endothelial cells (EC) and pericytes (PC) (PDGFrβ+ cells). (C) Foxc1 (green) and IB4 (red) immunostaining of E14.5 cerebral vessel. Arrows indicate Foxc1+ cells, C’ and C” depict individual channels. (D) Tie2-Cre; Foxc1-fl/+ and (E) Tie2-Cre; Foxc1-fl/fl adult mice immunostained with PECAM (green) which labels blood vessels and desmin (red) which labels smooth muscle cells and pericytes. Images of E16.5 (F) control- Pdgfrβ-Cre; Foxc1-fl/+ and (G) mutant Pdgfrβ-Cre; Foxc1-fl/fl embryos immunostained with GLUT1 (green) to label blood vessels. Arrowheads in (G) indicate dilated blood vessels. High-magnification images of E14.5 (H-I) cerebral cortex and (J-K) thalamus blood vessels (labeled with GLUT1 in red) from control and Foxc1lacz/lacz mutants. Scale bars = 200 μm (A), 50 μm (A’, A”, A”’, C, C’, C”), 100 μm (B, D-K).

