Figure 6.
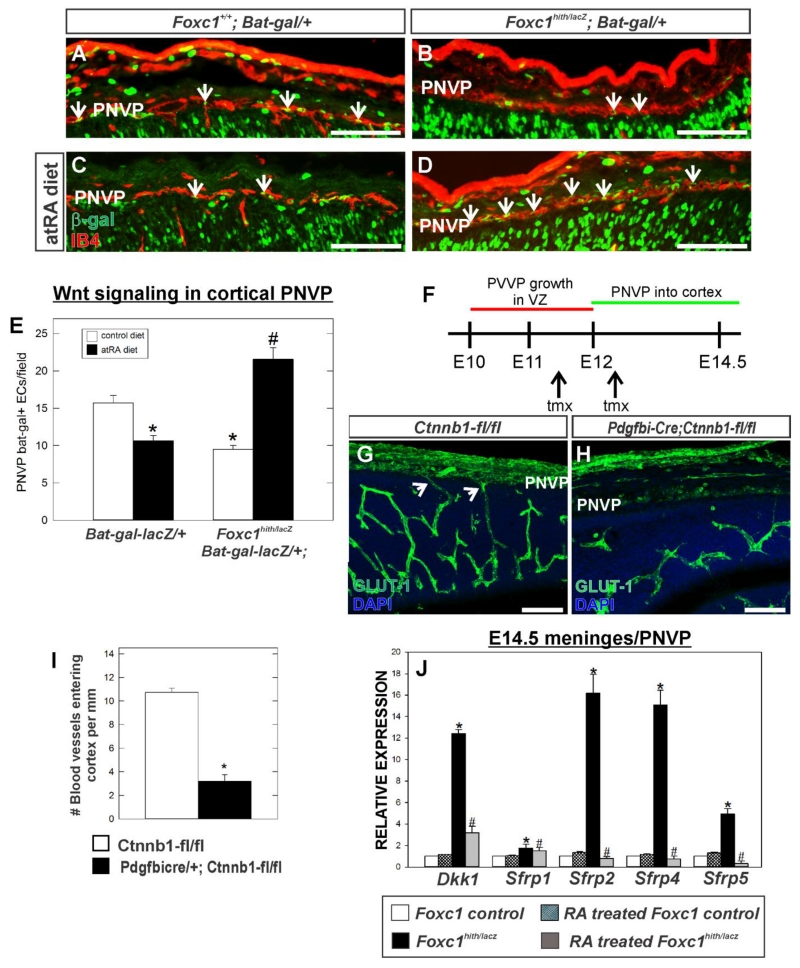
(A-D) Immunolabeling for β-galactosidase (β-gal) (green) and IB4 (red) of E14.5 coronal brain sections showing PNVP of the cerebral cortex from Foxc1+/+ and Foxc1hith/lacZ (Foxc1h/l) carrying the WNT reporter transgene, Bat-gal-LacZ. (E) Quantification of Bat-gal+ endothelial cells in PNVP per 20x field (n=3). Arrows indicate Bat-gal+/IB4+ endothelial cells. Asterisks indicate statistically significant decrease (p<0.05) from non-atRA control and hashtag (#) indicates a statistically significant increase (p<0.05) from a non-atRA treated control. (F) Approximate timeline PVVP and PNVP growth in the neocortex and timing of tamoxifen (tmx) injections for Pdgfbi-Cre;Ctnnb1-flox experiment. (G,H) E14.5 neocortex labeled with GLUT-1 from control (Ctnnb1-fl/fl) and mutant (Pdgfbi-Cre;Ctnnb1-fl/fl). Arrows indicate PNVP-derived vessels entering cerebral wall. (I) Quantification of number of blood vessels entering cerebral cortex from PNVP. Asterisks indicate statistically significant difference (p<0.05; n=3) from control. (J) Graph depicts gene expression of WNT inhibitors in E14.5 telencephalic meninges/PNVP from atRA-treated control (n=3) and mutants (Foxc1hith/lacZ) (n=3) relative to non-atRA treat control (n=3). Asterisks indicate statistically significant difference (p<0.05) from non-RA treated control. Hashtag (#) indicates statistically significant difference (p<0.05) from non-atRA Foxc1hith/lacZ mutant sample. Scale bars = 100 μm.

