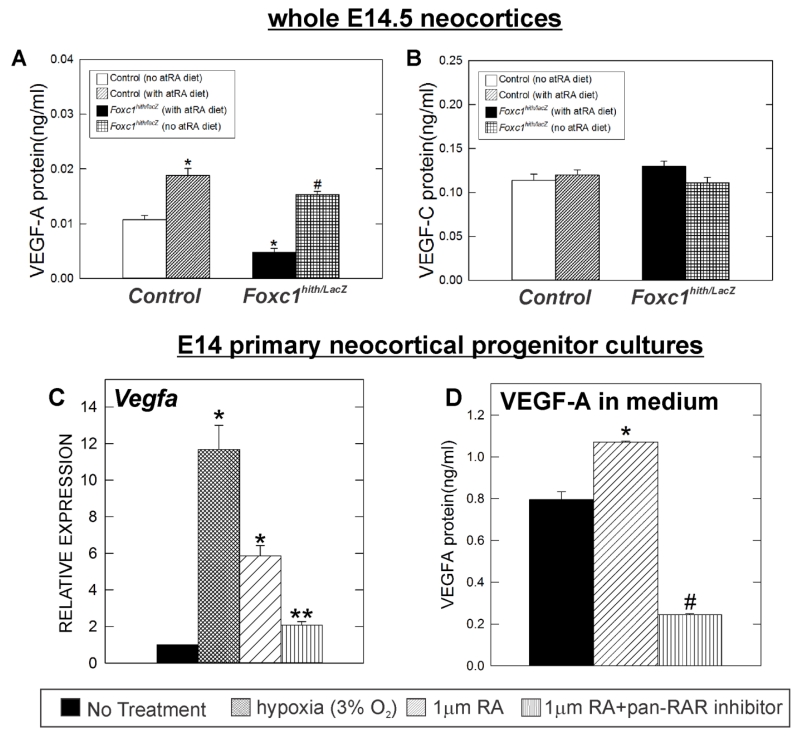
Figure 8.
(A) VEGF-A and (B) VEGF-C protein levels in E14.5 cortical lysates from non-treated (n=3) and atRA treated control (n=4) and mutants (Foxc1hith/lacZ) (n=3) quantified via ELISA. Asterisks indicate statistically significant difference (p<0.05) from non-RA treated control (n=4). Hashtag (#) indicates statistically significant difference (p<0.05) from both non-RA treated control and Foxc1hith/lacZ mutant samples. (C) Vegfa gene expression in hypoxia (n=3), atRA (n=3) or atRA+pan-RAR antagonist (n=3) treated E14 cortical progenitor cells relative to Vegfa expression of control (untreated E14 cortical progenitor cells) (n=3) measured by real time-PCR. (D) VEGF-A protein levels in conditioned medium collected from control (untreated) (n=3), atRA treated (n=3) and RA+pan-RAR antagonist (n=3) treated mouse E14 cortical progenitor cells.

