
Figure 3. Critical fluctuations in GPMVs and the 2D Ising model.
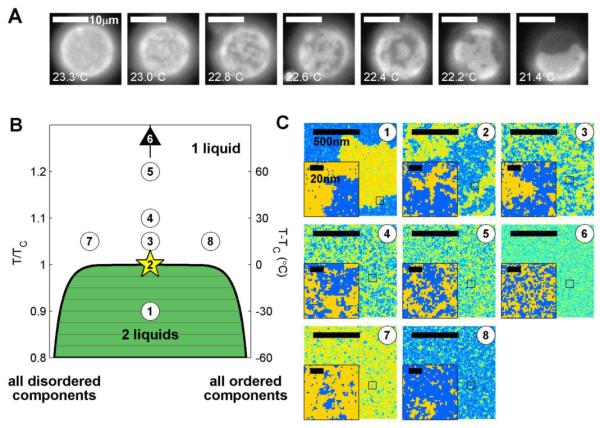
(A) Membrane heterogeneity emerges over an extended temperature range in GPMVs, consistent with their passing through a critical point at the miscibility transition temperature. (B) Miscibility phase diagram for the conserved order parameter 2D Ising model or binary fluid which contains only two components, referred to here as ordered or disordered components. The left axis shows temperature in units of the critical temperature (TC) while the right axis converts this to °C assuming that TC is 300K (27°C). (C) Simulation snap-shots from an equilibrated 2D Ising model for the conditions indicated in part B. Simulations were conducted using standard methods as described previously35. Insets are enlarged areas of the main image in the location indicated by a black box and indicate that structure on the 20nm scale is present even for conditions far removed from the critical point. Condition 6 is for an equal fraction of ordered and disordered components at a temperature of 2×TC or T-TC = 300°C, which is well outside of the temperature range plotted in B.