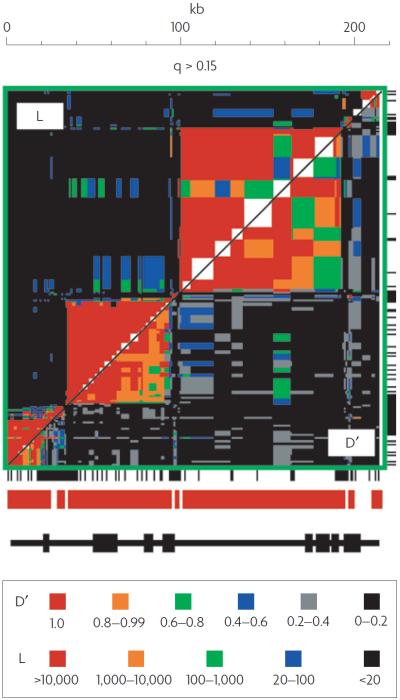
Figure 1. Haplotype blocks.
This graph provides some of the first evidence of haplotype blocks and their association with recombination hot spots. The figure shows the pattern of pairwise linkage disequilibrium (LD) in a 216 kb region of the class II region of the major histocompatibility complex in humans for all pairs of SNPs in the region for which the frequency (q) of the minor (that is, less common) allele exceeded 0.15. The region above the diagonal shows levels of L obtained when using D′ = 0 as the null hypothesis (L is the likelihood ratio from the test of linkage equilibrium). D′ is the ratio of D (a measure of LD) to its maximum possible absolute value, given the allele frequencies. This figure is reproduced, with permission, from Nature Genetics REF. 130 © (2001) Macmillan Publishers Ltd.

