
Figure 7.
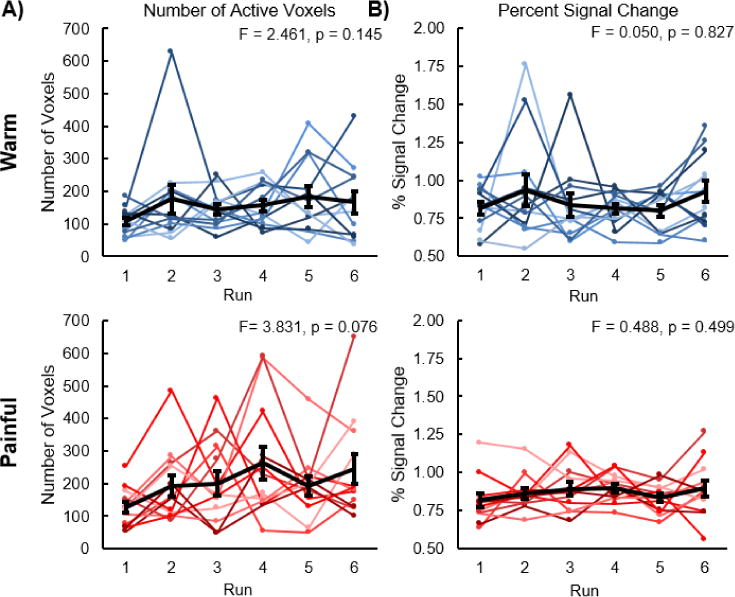
Number of active voxels and percent signal change of the active voxels across the subjects for each of the six runs. A) No linear increase or decrease in the number of active voxels was present for the warm stimulus. The number of active voxels tended to linearly increase for the painful stimulus, but this trend was not significant. B) No linear increase or decrease in the percent signal change of the active voxels was present for either the warm or painful stimuli. The average number of active voxels and the average percent signal change of the active voxels across the subjects are shown in black. The average percent signal change was calculated using the subject level activation maps generated from each run. Error bars = ± one standard error.