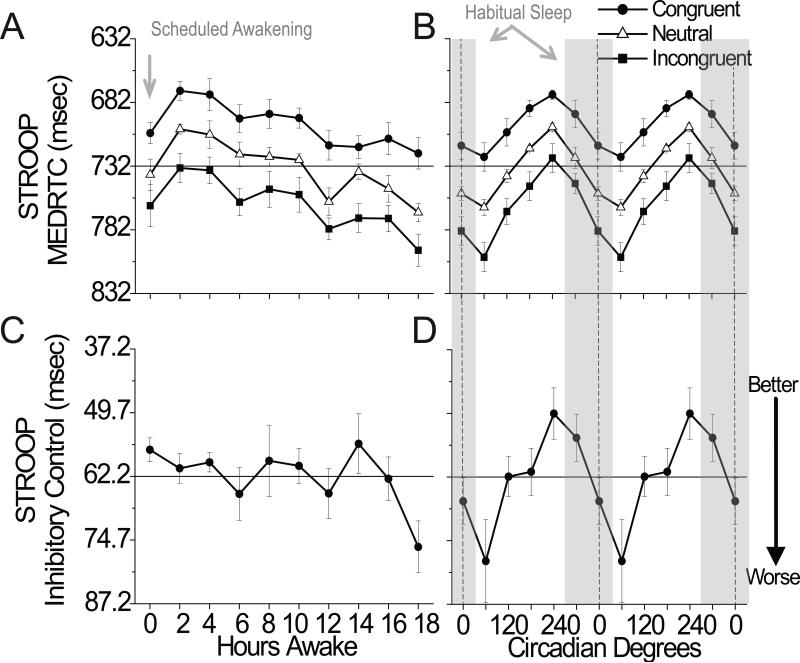
Figure 1. Influence of sleep inertia, homeostatic, and circadian components on Stroop Color Word Task (STROOP).
Left panels depict influence of hours awake (sleep inertia and sleep homeostasis) and right panels depict influence of circadian phase and are double plotted. Data aligned by fitted core body temperature minimum (CBT Min), defined as 0° (dashed line right panels). Gray bars depict when sleep habitually occurred prior to in-laboratory procedures. Data points represent deviations from mean±standard error (DFM±SEM). The grand mean (solid horizontal line) was incorporated into the figures to illustrate magnitude of change. Lower scores represent worse performance. MEDRTC, median reaction time for correct responses in msec for congruent (Cong), neutral (Neu) and incongruent (Inc) stimuli; inhibitory control (INH) score represents the difference between the congruent and incongruent stimuli MEDRTC in msec.

