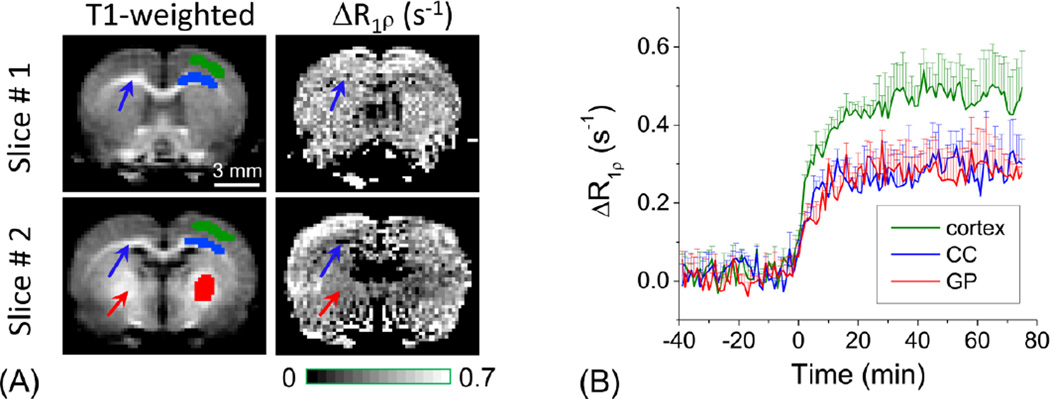
Fig. 5. Regional heterogeneity measured by high-resolution 2DG-CESL.
Comparison of T1-weighted images and maps of R1ρ changes (two slices) (A), and the time courses from the cortex, corpus callosum (CC, blue arrows), and globus pallidus (GP, red arrows) ROI (B). R1ρ changes with 333×333×1500 µm3 resolution were measured with 0.25 g/kg 2DG injection under 0.5% isoflurane. Pixels of ROIs were shown as green, blue and red color in the right hemisphere for the cortex, CC, and GP, respectively. Lower R1ρ change was observed in the CC and the globus pallidus indicating that 2DG-CESL correlates with glucose metabolism. Error bars: SD

