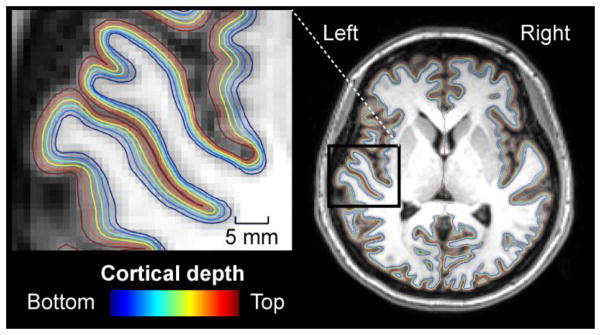
Figure 3.
A demonstration of the evenly spaced cortical surface depths in a representative subject. For clarity, only every other depth sampled in the present study, ranging from the white matter to the pial surface, is shown. The insert shows left hemisphere surfaces from areas including HG and the adjacent superior temporal and insular cortices. The fMRI data of the same subject are shown in Fig. 5.

