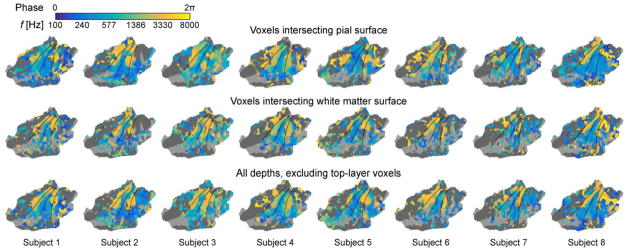
Figure 7.
Phase-encoded analysis of tonotopy progressions at different depths of AC, shown on a flattened patch of the left standard-brain superior temporal cortex (Freesurfer fsaverage). Consistent with main analyses (Fig. 4), the continuous tonotopy mapping results become more consistent and coherent after the exclusion of signals from voxels intersecting the top layers of AC.

