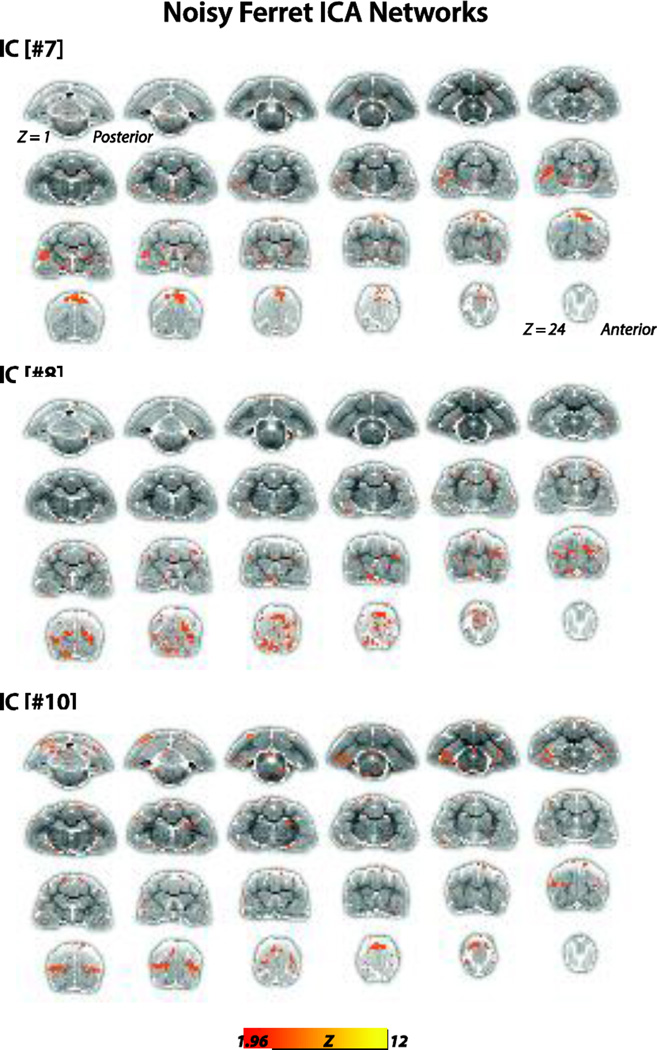
Figure 3.
Excluded gICA Networks. Group-level ICA components #7, 8, and 10 were excluded from further analysis upon failing the following criteria, components 1) consisted of relatively large continuous regions with Z-Correlations > 1.96, 2) connectivity patterns were largely bilateral, and/or 3) could be referred to anatomical landmarks comparable to well-known structures in existing literature of ferrets and other mammals. Connectivity maps are overlaid onto T2-anatomical images with red-yellow color encoding using a 1.96 < Z-score < 12 threshold (see colorbar).

