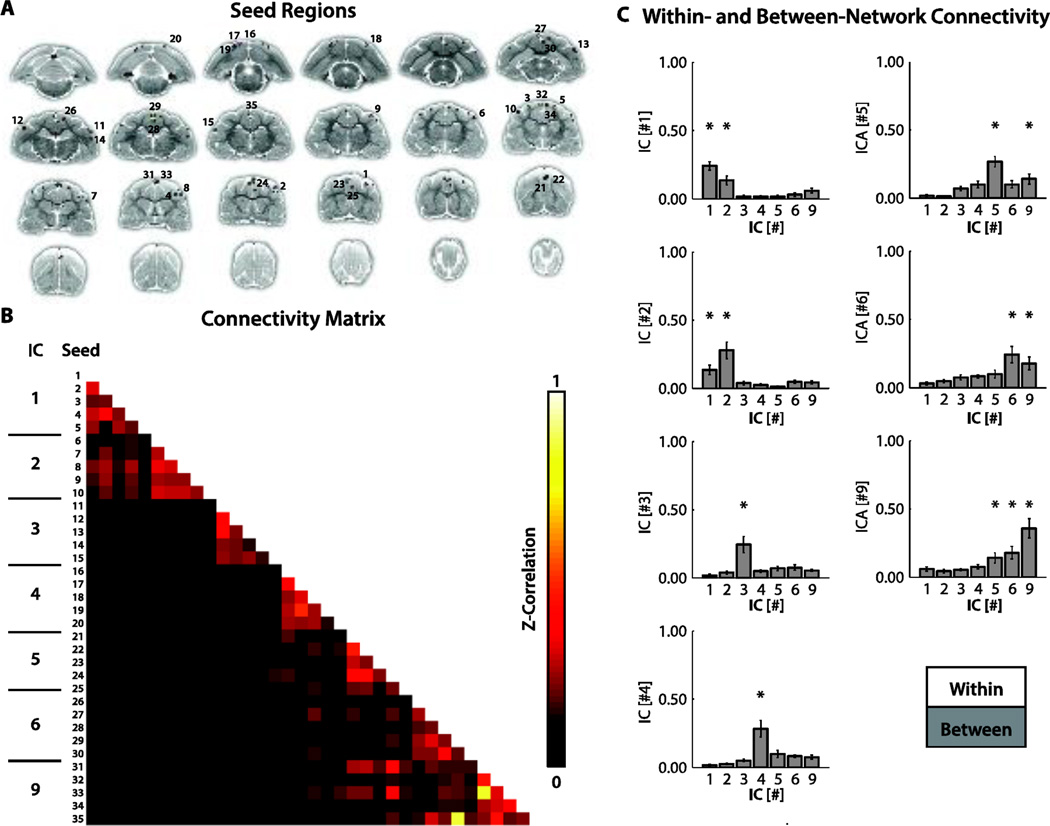
Figure 5.
Within- and between-network connectivity analysis. (A).Seeds for connectivity analysis. To compute within- and between-network connectivity, five spherical (radius of 1 mm) regions-of-interest (ROIs) were identified for each network. These ROIs were centered at the top five local maxima of the correlation map (minimum distance between each maxima was 3 mm), and served as representative samples of each network. Average BOLD time-series were extracted from each of the ROIs for subsequent correlation analysis. (B).Mean connectivity matrix. Group-level connectivity matrix of the average pair-wise correlations between the generated ROIs. Cells along the diagonal represent within-network connections and those that are off the diagonal represent between-network connections. Z-correlation strengths from 0 to 1 are represented by colors ranging from black to red to white (see colorbar). (C).Quantification of within- and between-network connectivity. To quantify the degree of within- and between-network connectivity, ROI correlation values were averaged across pairs for each network. Each bar graph represents mean correlation values relative to a particular network. White bars signify average correlation values for ROI pairs within the network and gray bars signify average correlation values for pairs where native ROIs were connected to ROIs in outside networks. * P < 0.05 (uncorrected) and μZ-Corr. ≥ 0.1

