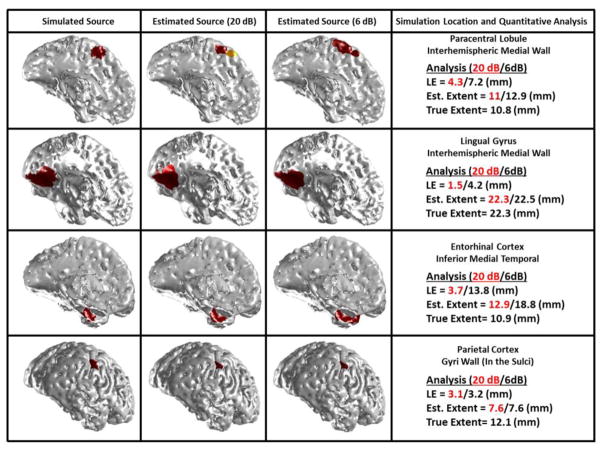
Fig. 12.
IRES sensitivity to source location and depth. Simulation results for four difficult cases are presented in this figure for two SNRs, i.e. 20 and 6 dB. The sources were simulated in the medial wall located in the interhemispheric region, medial temporal wall and sulci wall. The orientation of some of these deep sources is close to tangential direction.

