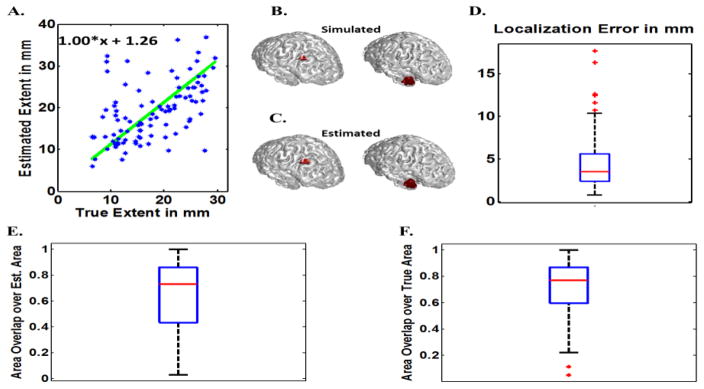
Fig. 8.
Monte Carlos simulations for differing BEM models with 20 dB SNR (IRES). The estimated source extent is graphed against the true (simulated source) extent (A). Two examples of the target (true) sources (B) and their estimated sources (C) are provided. The localization Error (D), Normalized overlaps defined as overlap area over estimated source area (F) and overlap area over true source area (F), are presented to evaluate the performance of IRES (all data). The boxplots show the distribution of each metric to provide a brief statistical review of the distribution of these metrics for all of the data. For more explanation about the metrics and how to interpret them please refer to the methods section of the paper.

