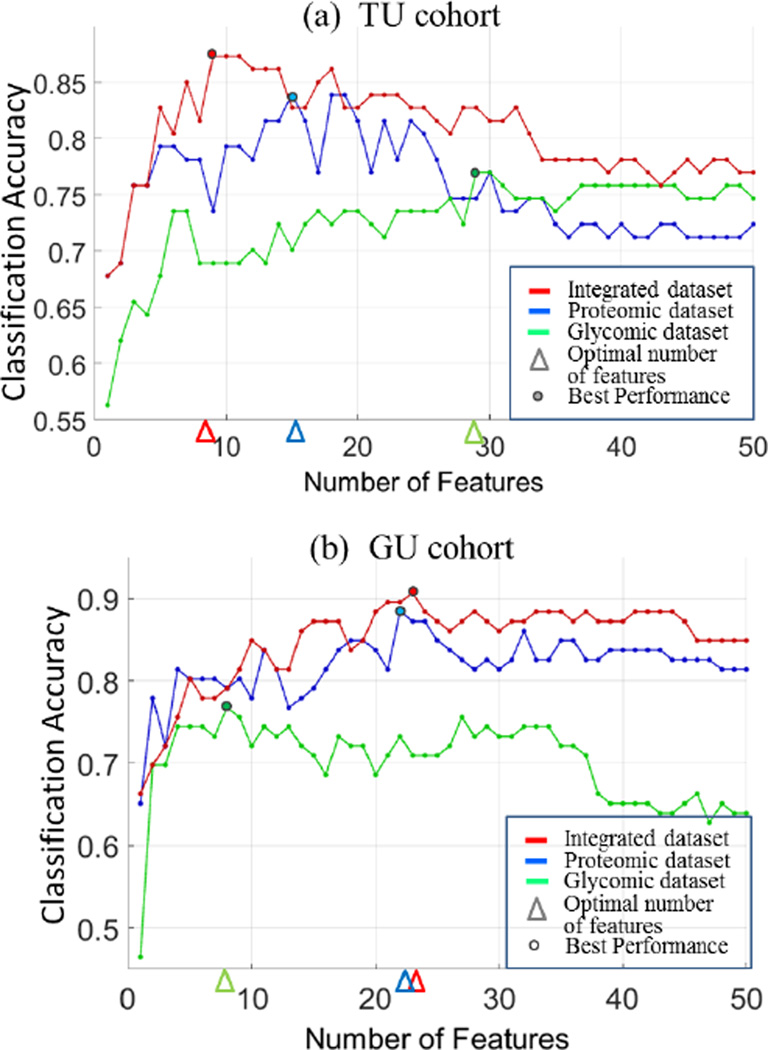
Figure 3.
Classification accuracy at each iteration step for the top 50 features from glycomic (green), proteomic (blue), and integrated datasets (red) in the TU and GU cohorts. The optimal numbers of features (indicated by triangles) correspond to the best classification accuracy (indicated by circles).

