. Author manuscript; available in PMC: 2017 Sep 1.
Published in final edited form as: IEEE J Biomed Health Inform. 2016 May 27;20(5):1225–1231. doi: 10.1109/JBHI.2016.2574201

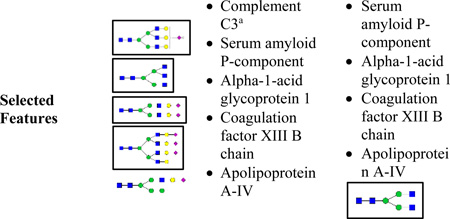
TABLE III.

Performance Comparison on the Top Rankning five Featured Selected in the TU Cohort.

TU cohort Glycomic Proteomic Integrated
(P & G))
Accuracy 0.68 0.79 0.83
Sensitivity 0.71 0.79 0.82
Specificity 0.67 0.79 0.85
AUC
(95% CI)
0.77
(0.65, 0.59)
0.88
0.77, 0.94)
0.89
(0.80, 0.95)
Number of
Selected
Features
5/82 5/101 5/183
graphic file with name nihms794406t1.jpg
a

Significant (p value ≤ 0.05) proteins in univariate statistical analysis. N-glycans that found significant (p value ≤ 0.05) in univariate statistical analysis are shown in boxes.

The results of best performing methods are marked in bold.